
建立與探索資料框
建立資料框
建立資料框之前通常習慣先將各個欄位生成為向量,我們大概猜想得到姓名應該是字串型的向量,而年齡會是數值型的向量。
資料框特性是可以容納不同的資料格式。
草帽海賊團主要角色設定有:
- 姓名
- 性別
- 職業
- 賞金
- 年齡
- 生日
- 身高
# 角色設定的向量
name <- c("Monkey D. Luffy", "Roronoa Zoro", "Nami", "Usopp", "Vinsmoke Sanji", "Tony Tony Chopper", "Nico Robin", "Franky", "Brook")
gender <- c("Male", "Male", "Female", "Male", "Male", "Male", "Female", "Male", "Male")
occupation <- c("Captain", "Swordsman", "Navigator", "Sniper", "Cook", "Doctor", "Archaeologist", "Shipwright", "Musician")
bounty <- c(500000000, 320000000, 66000000, 200000000, 177000000, 100, 130000000, 94000000, 83000000)
age <- c(19, 21, 20, 19, 21, 17, 30, 36, 90)
birthday <- c("05-05", "11-11", "07-03", "04-01", "03-02", "12-24", "02-06", "03-09", "04-03")
height <- c(174, 181, 170, 176, 180, 90, 188, 240, 277)

# 建立草帽海賊團角色設定的資料框
straw_hat_df <- data.frame(name, gender, occupation, bounty, age, birthday, height)
探索資料框
我們可以使用幾個好用的函數來快速探索一個資料框:
-
dim()函數會回傳資料框的列數與欄數 -
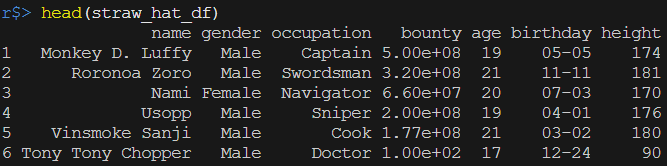
head()函數會回傳資料框的前六列
-
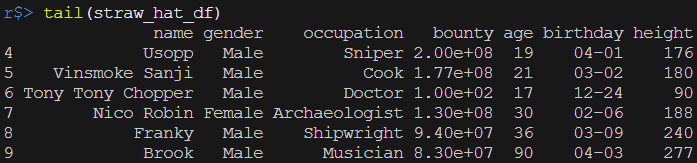
tail()函數會回傳資料框的後六列
-
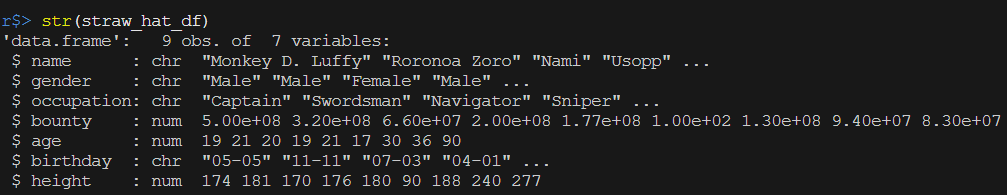
str()函數不僅會列出資料框的觀察值個數與變數個數,還會列出每個欄位的資* 料類型以及前幾個觀測值
-
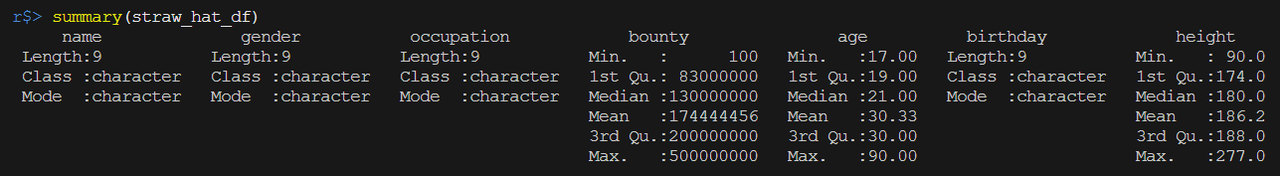
summary()函數會回傳量值型變數的敘述性統計資料,以及類別型變數的屬性資料
# straw_hat_df 已經預先載入
# 對 straw_hat_df 使用 dim() 、 head() 、 tail() 、 str() 與 summary()
dim(straw_hat_df)
head(straw_hat_df)
tail(straw_hat_df)
str(straw_hat_df)
summary(straw_hat_df)
依據欄位排序資料框
有時候我們對於資料框的外觀與排列會有自己的意見,例如會希望依照字母順序或者年齡大小的方式排序,在 R 語言可以使用 order() 函數來實現:
df[order(df$col, decreasing = FALSE)]
order() 函數預設都是遞增排序,所以 decreasing = 的參數預設為 FALSE,如果我們希望是遞減排序就必須將參數設為 decreasing = TRUE。
# straw_hat_df 已經預先載入

# 用 height 遞增排序
straw_hat_df[order(straw_hat_df$height, decreasing = FALSE), ]

# 用 bounty 遞減排序
straw_hat_df[order(straw_hat_df$bounty, decreasing = TRUE), ]
欄與列的相關技巧
新增欄位
將 favorite_food 加入 straw_hat_df 中。
# straw_hat_df 已經預先載入
# 最喜愛料理的向量
favorite_food <- c("Meat", "Food matches wine", "Orange", "Fish", "Food matches black tea", "Sweets", "Food matches coffee", "Food matches coke", "Milk")

# 將向量加入資料框中成為新的欄位
straw_hat_df$favorite_food <- favorite_food

# 將資料框輸出在 R Console
straw_hat_df
新增欄位(2)
R 語言有一個很可愛的特性是殊途同歸,做同樣一件事情,可能有多種方式可以達成。
在這個練習中我們要介紹如何使用 cbind() 函數來將 favorite_food 加入 straw_hat_df 中。
df <- cbind(df, column_to_add)
# 最喜愛料理的向量
favorite_food <- c("Meat", "Food matches wine", "Orange", "Fish", "Food matches black tea", "Sweets", "Food matches coffee", "Food matches coke", "Milk")

# 利用 cbind() 函數將向量加入資料框中成為新的欄位
straw_hat_df <- cbind(straw_hat_df, favorite_food)

# 將資料框輸出在 R Console
straw_hat_df
刪除欄位
將 favorite_food 從 straw_hat_df 中移除,在 R 語言中要將資料框中的欄位移除非常容易,只需要把該欄位指派為 NULL 即可:
df$column_to_delete <- NULL
# 刪除最喜愛料理的欄位
straw_hat_df$favorite_food <- NULL
# 將資料框輸出在 R Console
straw_hat_df
刪除欄位(2)
我們也可以利用subset()來刪除欄位,只需在想要刪除的欄位名稱前面加上減號,而且提供了更進階的功能,可以一次刪除多個欄位。
df <- subset(df, select = -col1)
df <- subset(df, select = c(-col1, -col2, ...))
# 用 subset 函數一次刪除職業與身高兩個欄位
straw_hat_df <- subset(straw_hat_df, select = -c(occupation, height))

# 將資料框輸出在 R Console
straw_hat_df
為欄位重新命名
R 語言可以使用 names() 函數將資料框的「變數名稱」以向量的型態輸出:
names(df)
透過指定索引值就可以對欄位重新命名:
names(df)[1] <- "new_name_column1"
注意 R 語言的索引值是由 1 起算,這一點跟其他程式語言從 0 起算是不一樣的!
# straw_hat_df 資料框已預先載入

# 將賞金欄位 straw_hat_df$bounty 改命名為 straw_hat_df$reward
names(straw_hat_df)[names(straw_hat_df) == "bounty"] <- "reward"

# 將 straw_hat_df 的欄位名稱輸出在 R Console
names(straw_hat_df)
鑽研 subset() 函數
前面練習示範的刪除欄位只是 subset() 函數的其中一個功能。subset() 函數在篩選觀測值與變數非常實用
subset(straw_hat_df, name == "Monkey D. Luffy", select = c(name, bounty))
# straw_hat_df 資料框已預先載入

# 篩選賞金大於 1000 萬貝里並且年齡小於 30 歲,欄位只需要包含姓名、賞金與年齡
subset(straw_hat_df, bounty > 10000000 & age < 30, select = c(name, bounty, age))
新增列數
除了 cbind() 函數能協助新增欄位,也有相對應的函數可以協助新增列數。
R 語言有相對應的 rbind() 函數:
df <- rbind(df, row_to_add)
# straw_hat_df 資料框已預先載入

# 薇薇公主
princess_vivi <- c("Nefeltari Vivi", "Female", "Princess of Alabasta", NA, 18, "02-02", NA)

# 將薇薇公主加入草帽海賊團資料框
straw_hat_df <- rbind(straw_hat_df, princess_vivi)

# 把 straw_hat_df 輸出在 R Console
straw_hat_df
生成衍生變數
類別型變數的分類
交戰區分為兩種類型:輔助型與戰鬥型。多加一個欄位紀錄船員們的戰鬥類型 battle_role,這樣的二元重新分類可以善用 ifelse() 函數
ifelse(test, yes, no)
在對比文字時我們使用一個特殊的運算子符號 %in%,如果運算子左方的文字有出現在右方的向量中,就會回傳 TRUE 反之則回傳 FALSE。
# straw_hat_df 已預先載入

# 填入適當的值
straw_hat_df$battle_role <- ifelse(straw_hat_df$occupation %in% c("Navigator", "Sniper", "Doctor", "Archaeologist"), "Support", "Fighter")

# 將資料框輸出在 R Console
straw_hat_df
類別型變數的分類(2)
在輔助型戰鬥角色中,再將狙擊手(Sniper)另外歸類為遠距攻擊型(Range),而船醫(Doctor)、考古學家(Archaeologist)與航海士(Navigator)仍然歸類為輔助型(Support),原本歸類為戰鬥型(Fighter)的船長(Captain)、劍士(Swordsman)、廚師(Cook)、船匠(Shipwright)與音樂家(Musician)則維持原歸類,如此一來類別會達到三種,這時採用向量索引值進行歸類。
# straw_hat_df 已預先載入

# 填入適當的值
straw_hat_df$battle_role[straw_hat_df$occupation == "Sniper"] <- "Range"
straw_hat_df$battle_role[straw_hat_df$occupation %in% c("Navigator", "Doctor", "Archaeologist")] <- "Support"
straw_hat_df$battle_role[straw_hat_df$occupation %in% c("Captain", "Swordsman", "Cook", "Shipwright", "Musician")] <- "Fighter"

# 將資料框輸出在 R Console
straw_hat_df
數值型變數的分類
想要將船員依照賞金級距切分為低、中與高三個等級,這個作法如同新增加了一個類別型變數,但卻是由既有的數值型變數所衍生得到。在 R 語言中,我們可以善用 cut() 函數來做這件事情。
df$new_column <- cut(df$column, breaks = c(0, break1, break2, Inf), labels = c("label1", "label2", "label3"))
其中 breaks 參數設定必須要有一個最小值與最大值,範例中是指介於 0 - break1 的數值歸類為 label1,介於 break1 - break2 的數值歸類為 label2,而介於 break2 - Inf 的數值歸類為 label3,Inf 在 R 語言中是無限大的數值,你可以在 R Console 中輸入 class(Inf) 來驗證。
# straw_hat_df 已預先載入

# 填入適當的值
straw_hat_df$bounty_level <- cut(straw_hat_df$bounty, breaks = c(0, 83000000, 180000000, Inf), labels = c("Low", "Medium", "High"))

# 將資料框輸出在 R Console
straw_hat_df
衍生計算數值型變數
通常在處理較大數量級的變數時會轉換單位,像是千、百萬或者十億。現在就讓我們來新增一個以百萬元貝里作為單位的變數 bounty_million。
# straw_hat_df 已預先載入

# 新增一個以百萬元貝里作為單位的 straw_hat_df$bounty_million
straw_hat_df$bounty_million <- straw_hat_df$bounty/1000000

# 將資料框輸出在 R Console
straw_hat_df
較難的衍生變數
我們要先介紹 Sys.Date() 這個函數,它會回傳現在的系統日期,你可以在 R Console 輸入:
-
Sys.Date()
R Console 會將現在的系統日期以"%Y-%m-%d"的格式回傳。%Y 代表四位數字的西元紀年,%m代表兩位數字的月份,%d代表兩位數字的日期。而運用format()函數可以得到我們需要的西元年。 -
format(Sys.Date(), '%Y')
產生出來的西元年格式是字元,如果想要做運算還需要利用as.numeric()轉為數值。
as.numeric(format(Sys.Date(), '%Y'))
# 產生 sys_date
sys_date <- Sys.Date()

# 產生 sys_date_year
sys_date_year <- format(Sys.Date(), '%Y')

# 產生 sys_date_year_num
sys_date_year_num <- as.numeric(format(Sys.Date(), '%Y'))

# 將 sys_date 、 sys_date_year 與 sys_date_year_num 輸出在 R Console
sys_date
sys_date_year
sys_date_year_num
較難的衍生變數(2)
前面已經生成被儲存為數值類型的系統日期西元年份,接下來用每個船員各自的年齡來計算生日的西元年份,R 語言的使用者在產生衍生變數的過程不喜歡扛著整個資料框,於是我們會先將要使用於計算的變數獨立出來:
rvector1 <- df$col1
計算後我們會得到船員的生日西元年份,但是你忽然想起來 birthday 是儲存成字元的資料格式,於是在結合之前可別忘了使用 as.character() 函數轉換為字元!
# straw_hat_df 與 sys_date_year_num 已預先載入

# 宣告 age 向量
age <- straw_hat_df$age

# 宣告 birthday 向量
birthday <- straw_hat_df$birthday

# 用 sys_date_year_num 減去 age 並指派給 birth_year
birth_year <- sys_date_year_num-age

# 利用 as.character 將 birth_year 轉換成字元並指派給 birth_year_char
birth_year_char <- as.character(birth_year)

# 將 birth_year 與 birth_year_char 輸出在 R Console
birth_year
birth_year_char
較難的衍生變數(3)
接下來要將剛剛生成的 birth_year_char 與 birthday 結合,字串的結合我們要使用 paste() 函數:
char_pasted <- paste(char1, char2, sep = " ")
注意預設的 sep = 參數是空格,由於西元日期會以 - 連接,所以記得要使用 sep = "-"。結合好以後我們只需使用 as.Date() 函數將字元轉換成日期格式,就可以將這個向量新增至資料框了!
# straw_hat_df 、 birthday 與 birth_year_char 已預先載入

# 結合 birth_year_char 與 birthday
birth_date_char <- paste(birth_year_char, birthday, sep = "-")

# 將 birth_date_char 轉成日期 birth_date
birth_date <- as.Date(birth_date_char)

# 將 birth_date 新增至資料框
straw_hat_df$birth_date <- birth_date

# 將資料框輸出在 R Console
straw_hat_df
欄位聚合與資料轉置
摘要統計
之前有介紹 summary() 函數,它可以幫助你快速暸解資料框的摘要,而summary() 函數除了可以應用在整個資料框之外,其實也可以使用在單一的變數上:
summary(df$col)
我們也可以善用簡單的 sum() 函數或 sd() 函數產出統計值,不一定只能仰賴 summary() 函數產出既定的摘要統計值。
# straw_hat_df 已預先載入

# 對 straw_hat_df 使用 summary()
summary(straw_hat_df)

# 對 straw_hat_df$height 使用 summary()
summary(straw_hat_df$height)

# 對 straw_hat_df$bounty 使用 sum()
sum(straw_hat_df$bounty)

# 對 straw_hat_df$bounty 使用 sd()
sd(straw_hat_df$bounty)
摘要統計(2)
接下來學習使用類似在 Excel 中常用的樞紐分析表,為了簡單地達成,使用 ddply() 函數,由於它不是 R 語言的原生函數,而是源自於一個套件 plyr,因此在使用前必須要使用 library() 函數將 plyr 套件載入。
library(plyr)
ddply() 函數需要輸入較多參數,.variables = 要放的是欲分別摘要的類別型變數,.fun = summarise 在現階段先不做更動,後面則是加上聚合計算欄位的名稱與算式:
ddply(df, .variables = c("category1", "category2", ...), .fun = summarise, mean_value1 = mean(value))
# straw_hat_df 已預先載入

# 用 head() 函數看一下 straw_hat_df
head(straw_hat_df)

# 載入 plyr 套件
library(plyr)

# 依據 gender 計算平均身高
ddply(straw_hat_df, .variables = "gender", .fun = summarise, avg_height = mean(height))

# 依據 battle_role 計算加總賞金

ddply(straw_hat_df, .variables = "battle_role", .fun = summarise, ttl_bounty = sum(bounty))
# 依據 gender 與 battle_role 計算平均身高與加總賞金
ddply(straw_hat_df, .variables = c("gender", "battle_role"), .fun = summarise, avg_height = mean(height), ttl_bounty = sum(bounty))
資料轉置:寬變長
我們首先介紹如何將一個寬資料框變為長資料框,在之前資料框中有 2 個整數欄位,分別是 age 和 height,我們可以改用一個類別欄位儲存數值的種類以及一個數值欄位儲存數值。
# straw_hat_df 已預先載入
straw_hat_df

# 建立一個新的資料框 straw_hat_wide_df 僅包含姓名、年齡與身高
straw_hat_wide_df <- straw_hat_df[, c("name", "age", "height")]
straw_hat_wide_df
資料轉置:寬變長(2)
寬資料框變為長資料框時需要使用 gather() 函數,源自 tidyr 這個套件。
接著使用 gather() 函數來把寬資料框變為長資料框,gather() 函數必須要指定幾個參數,第一個是寬資料框名稱,而 key = 是轉置後用來儲存數值種類的欄位名稱,value = 是轉置後用來儲存數值的欄位名稱。後面則輸入需要被轉置的原始欄位名稱 :
gather(df_wide, key = 新命名一個變數區分數值的種類, value = 新命名一個變數存放數值, 原始數值欄位1, 原始數值欄位2, ...)
# straw_hat_wide_df 、 tidyr 已預先載入
# 轉置
straw_hat_long_df <- gather(straw_hat_wide_df, key = new, value = name, age, height)

# 將資料框輸出在 R Console
straw_hat_long_df
資料轉置:長變寬
進行長資料框轉置為寬資料框時我們使用同樣源於 tidyr 套件的 spread() 函數。函數必須要指定幾個參數,第一個是長資料框名稱,而 key = 是用來儲存數值種類的欄位名稱,value = 是用來儲存數值的欄位名稱:
spread(df_long, key = 類別欄位, value = 數值欄位)
# straw_hat_long_df 、 tidyr 已預先載入

# 將 straw_hat_long_df 輸出在 R Console看看
straw_hat_long_df

# 轉置
straw_hat_wide_df <- spread(straw_hat_long_df, key =cate , value = int)

# 將 straw_hat_wide_df 輸出在 R Console看看
straw_hat_wide_df
聯結資料框
內部聯結
現在你手邊已經取得了 straw_hat_devil_fruit,接著你想要把它加入原本的資料框中。
R 語言使用 merge() 函數來進行資料框的聯結,如果你沒有使用過關聯式資料資料庫,你可以想像一下 Excel 的 vlookup 函數功能。
merge(df1, df2, by = "foreign_key_column", ...)
by = 參數要指定兩個資料框參照的欄位,由於我們的資料框要參照的欄位名稱是相同的: name,因此在使用 merge() 函數時不需要指定 by = 參數。
輸出的結果會保留兩個資料框中有參照到的觀測值,這就是俗稱的內部聯結!
# straw_hat_df 與 straw_hat_devil_fruit 已預先載入

# 聯結資料框
straw_hat_df_devil_fruit <-merge(straw_hat_df, straw_hat_devil_fruit)

# 將結果輸出在 R Console
straw_hat_df_devil_fruit
左外部聯結
回憶前一個練習最後的輸出,我們原本的資料框有 9 個船員,但是其中只有 4 個船員是惡魔果實能力者,因此當 merge() 函數沒有做其他參數設定時,預設即為內部聯結,輸出結果只會有兩個資料框交集的船員。
如果想要保留所有船員的資料,要在 merge() 函數中額外指定參數 all.x = TRUE 請 R 語言將第一個資料框的所有觀測值都保留下來:
merge(df1, df2, all.x = TRUE)
輸出的結果會保留第一個資料框中的所有觀測值,而參照不到惡魔果實的船員會以遺漏值記錄,這就是俗稱的左外部聯結!
# straw_hat_df 與 straw_hat_devil_fruit 已預先載入

# 左外部聯結
straw_hat_df_devil_fruit <- merge(straw_hat_df, straw_hat_devil_fruit, all.x = TRUE)

# 將結果輸出在 R Console
straw_hat_df_devil_fruit
右外部聯結
與前一個練習相呼應,既然有保留第一個資料框所有觀測值的左外部聯結,我們一定也有保留第二個資料框所有觀測值的右外部聯結。想要保留所有惡魔果實能力者的資料,要在 merge() 函數中額外指定參數 all.y = TRUE 請 R 語言將第二個資料框的所有觀測值都保留下來:
merge(df1, df2, all.y = TRUE)
為了展示右外部聯結的效果,我們稍微修改了第一個資料框 straw_hat_df 留下四個船員的角色設定,兩個能力者與兩個非能力者。輸出的結果會保留第二個資料框中的所有觀測值,而參照不到主要角色設定的惡魔果實能力者欄位會以遺漏值記錄,這就是俗稱的右外部聯結!
# straw_hat_df 與 straw_hat_devil_fruit 已預先載入

# 將 straw_hat_df 輸出在 R Console
straw_hat_df

# 右外部聯結
straw_hat_df_devil_fruit <- merge(straw_hat_df, straw_hat_devil_fruit, all.y = TRUE)

# 將結果輸出在 R Console
straw_hat_df_devil_fruit
全外部聯結
既然有保留第一個資料框所有觀測值的左外部聯結,亦有保留第二個資料框所有觀測值的右外部聯結,聰明如你一定想到我們必定有保留兩個資料框所有觀測值的聯結,你的推測沒有錯,那就是俗稱的全外部聯結,在 merge() 函數中額外指定參數 all.x = TRUE 以及 all.y = TRUE 請 R 語言將兩個資料框的所有觀測值都保留下來:
merge(df1, df2, all.x = TRUE, all.y = TRUE)
# straw_hat_df 與 straw_hat_devil_fruit 已預先載入

# 將 straw_hat_df 輸出在 R Console
straw_hat_df

# 全外部聯結
straw_hat_df_devil_fruit <- merge(straw_hat_df, straw_hat_devil_fruit, all.x = TRUE, all.y = TRUE)

# 將結果輸出在 R Console
straw_hat_df_devil_fruit
多個參照欄位
們如果要參照不只一個欄位時,在 by = 的參數設定要使用 c() 將多個參照欄位寫入:
merge(df1, df2, by = c("col1", "col2", ...))
# luffy_event_bounty 與 luffy_event 都已預先載入

# 將 luffy_event_bounty 與 luffy_event 輸出在 R Console
luffy_event
luffy_event_bounty

# 內部聯結
luffy_bounty <- merge(luffy_event, luffy_event_bounty)

# 將 luffy_bounty 輸出在 R Console
luffy_bounty